When you click on links to various merchants on this site and make a purchase, this can result in this site earning a commission. Affiliate programs and affiliations include, but are not limited to, the eBay Partner Network. As an Amazon Associate I earn from qualifying purchases. #ad #promotions
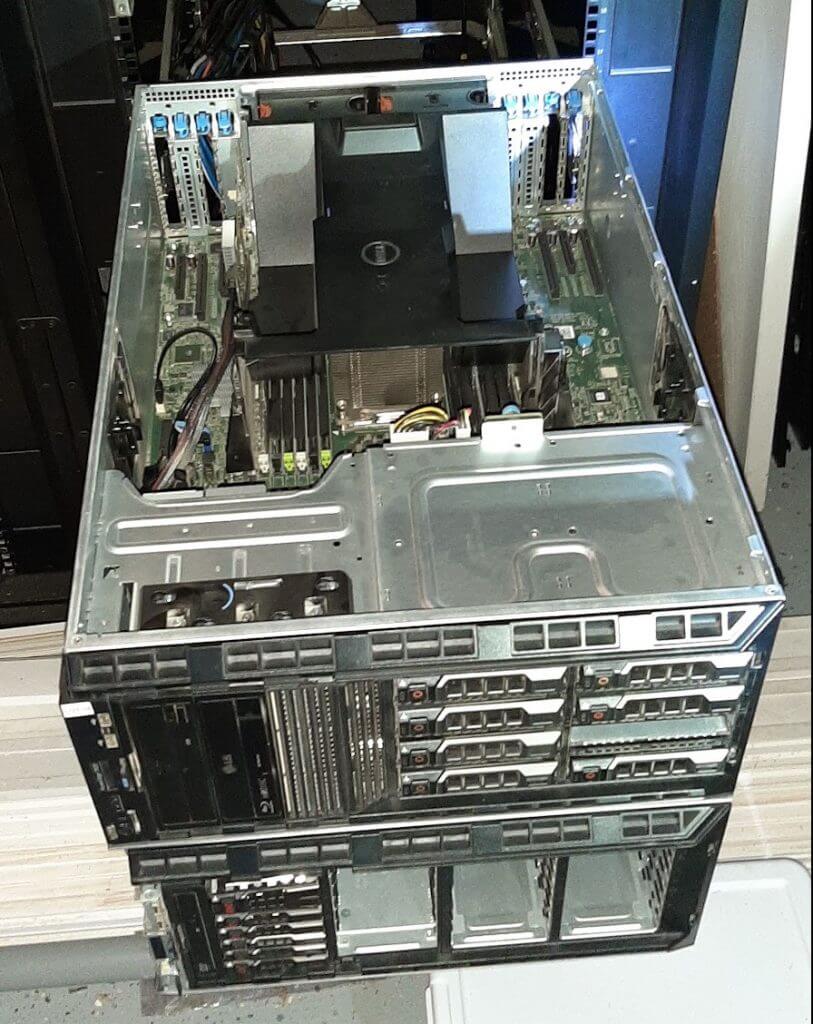


The Dell PowerEdge T620
Originally the most flexible 12th generation IO server platforms from Dell, this is a crazy good machine even today.
The Dell T620 is still a powerhouse capable of some impressive heavy lifting with a large supporting IO platform, dual socket processors, quad GPU support and ram capacity for up to 1.5TB of DDR3. The platform has several configurations and among those is providing up to 32 x 2.5″, 12 x 3.5″ or the most common the 8 x 3.5″ and 16 x 2.5″ platform for IO in large high performance arrays.
The dual socket, E5 V1 or V2 platform can house processors that are capable of handling heavy lifting for everything from home workstation virtualization, multiple gaming desktop environments and of course… chia plotting! The T620 is awesome because it has support for configurable “tower mode” with feet or casters and ipmi controllable fans to make it an easy on the ears addition inside the house. With some easy changes to the chassis and some rails and a few wire swaps, you have a 5U rackmount beast. Before being repurposed as a bare metal chia plotter, it was the whole house workstation server.
A Realistic Whole House Multi-Workstation-Gaming Machine
We had it running 4 x Windows 10 terminals with dedicated modern gpu’s including a 1080ti, 1070 and 1060 as well as single slot 1030 and usb connections throughout the house, 3 additional Windows 10 RDP hosts and 8 KVM guests all without breaking a sweat in Proxmox 6.4. Do note that the 8bay T620 CANNOT be upgraded to add in an additional 16 2.5 drives (been there, tried that). However, the 16 bay 2.5 can have an add-on 16 2.5 cage installed to turn them into a 32 2.5 drive machine, especially potent when using 2 HBA’s, one for each backplane.
Build Configurations for Dell T620
In this guide I am going to outline the build guide for the Dell PowerEdge T620 that I am using in the extensive testing I have done and link to all the resources around the results and platform I have created.
My Dell T620 Server consists of the following parts.
1 x Dell PowerEdge T620 in 16 bay form factor w/ iDrac Enterprise:
2 x H710 flashed to HBA mode LSI 9205 P/N: NHGT2
1 x 128 GB DDR3 1333 P/N:
1 x Casters (Movable Tower) P/N: F640C
1 x GPU adapter for quad GPU P/N: VDY5T
4 x GPU Power Cables P/N: 3692K
2 x 1100w Platinum PSU’s P/N: GDPF3
1 x Dell Fan Assembly P/N: 8G79K
1 x 16 2.5″ Extra Backplane P/N: 018G5
1 x Additional 16 bay cage insert P/N: CXPMW
1 x Extra Backplane SAS Cable P/N: 9DHPJ
1 x Extra Backplane Signal Cable P/N: KV109
16 x Samsung 870 Evo 1 TB SSD’s P/N:
General notes, tricks and tips for the T620
Fohdeesha H710/H310/H810 flashing all in one scripts and directions – Guide for flashing the H710 the easy way to the LSI HBA mode
You need to run the 1100 watt psu’s if you are running the GPU board. You also should have the Midplane fan assembly, which cools amazingly and responds to ipmi.
If you are using ALL dimm slots, you will be limited to 1333 speeds regardless of the ram speed. This is according to the manual and unverified by me, but 1333 is cheaper than 1600 as well.
If you buy a 16 x 2.5″ form factor, then you CAN add in a second 16 x 2.5″ bay backplane. The backplanes support split or dual mode, so you can run 2 x raid adapters or HBA’s depending on your need. You can even run a cable from another machine to one of the backplanes and that works as well.
Chia Plotting Settings, Times and Benchmarks
With testing done on a variety of ramdisk sizes, RAID0 -t configurations, operating systems and dual processors including the E5-2650 v2, E5-2667 v2, E5-2697 v2, E5-2637 v2, and E5-2630L processors, you can get a taste for one of the most plotted out machines in multiple configurations with recorded data. I have more numbers from this server than the others so let’s get into them.
Windows Server 2022:
https://gist.github.com/jollyjollyjolly/806cb8b995efef5211ad3460173f459c
https://docs.google.com/spreadsheets/d/1Bzqr7QIPu0baYfxF9jTk2yS7h4qrJhgpS4sB9lDMxQ4/edit?usp=sharing
Windows presented me with a lot of issues with NUMA, RAM usage and/or OS version. I did an earlier video right when pool plots dropped and ran into some horrible times running the same tests I had run to get my best times, so something was clearly wonk. I got some suggestions from the comments that I might look into NUMA handling and the specific version of windows I was using. Server 2016 was certainly at some point in the T620 lifespan, a well used system that I would have thought would have had bugs like this hammered out by Dell or MS at some point, however I decided to roll the dice and upgrade to 2022 preview and also to fill all the RAM banks. One of those 2 fixed the bizarre issue. I embarked on a second issue resolution and follow-up benchmark video (in windows) and got the results above which I was then able to put head to head with Ubuntu to challenge the often asked question… “Is Windows Slower than Linux?” and the answer is a resounding YES. I was further able to classify some uses when Windows comes close, and they are surprisingly at the lower count of disks + ramdisk as well as pure disk based plotting. I should of course mention all plotting was done with MadMax plotter built for Windows. The final test, a bonus I added on at the end to test a theory I developed while shooting the video, panned out to be the best performer. Shocker, it involved NO RAMDISK. With 2 x 1TB SSD’s in a RAID0 for the -t and another 6 x 1TB SSD’s in a raid0 for the -2, this illustrates what I feel is a happy ratio (relative to the other tests I ran) for performance with the pcie bandwidth available on my flashed H710 and also the processor’s capabilities.
Ubuntu:
https://gist.github.com/jollyjollyjolly/056903be36ea387ba6da03e906971b96
https://docs.google.com/spreadsheets/d/1Bzqr7QIPu0baYfxF9jTk2yS7h4qrJhgpS4sB9lDMxQ4/edit?usp=sharing
The times I was able to get running the pure ramdisk (256GB) in the head to head vs Windows really laid out a difference in how tempfs is accessed and how the operating systems diverge drastically in that handling. In addition, the times that I got that came closest to an interesection was a single 1TB SSD and a 110G ramdisk, quite a bit more affordable than the Windows 8 disk alternative if you are looking at DDR3 costs. This chart’s times and curve looked much like I expected they would, but this does lay to rest the question (I hope) about performance and what can be gained by using a Linux distro paired with MadMax.
Chia plotting is a demanding workload for a complete computer (well minus the GPU….so far)