

Today we are digging into the speed comparison for Windows and Ubuntu. The results are pretty surprising but also expected. The question we are testing is “Is Window or Ubuntu faster for creating plots with Mad Max plotter?” The answer up front is, it depends. First, the configuration of your system depends on if you are using a Desktop Build or Server Build. Secondly, it depends on the generation age of the system that is in use.
Let’s dive into the benchmarks we did on the Dell T620 in both Windows and Ubuntu with a large variety of disks and ramdisks.
Just to clarify upfront for those with NVME drives that have a high level of performance after the cache is used up, you get dropped into the performance grouping of 3-4 SSDs in a Raid0 after the cache is used up. Plotting Chia exhausts the cache of these devices. If you have an NVME gen 3 or a poorer performance gen4, you hit around the 2 SSD Raid0 performance level after you have eaten up your cache. Raid0 has a benefit at the addition of disks, in a 1TB size on a quality drive like the 870EVO, that you have sustained writes around 500MB/s across the entire disk. Add 2 disks, you now have a 2TB high speed disk. 4 disks, 4TB high speed. This makes SSDs in a pcie-3 setting more attractive as I have additional uses for them beyond plotting.
Mad Max Plotter for Desktops
Most people that are using Mad Max on a Desktop Build are also using Windows 10, soon to be Windows 11. So, you might have a few constraints and a few advantages that relate directly to Plotting Chia with Mad Max Plotter.
Limitations of Desktop Builds:
- Single CPU processor systems
- Limited number of RAM slots
- Fewer RAM slots = 32GB sticks to get to 128GB ramdisk.
- Reliant on 3rd party software to create ramdisks
- Limited number of NVME and SATA ports
- Airflow concerns for enclosed cases without high airflow design
Benefits of Desktop Builds:
- Easy to adapt to another purpose
- Higher availability worldwide
- Uses modern parts that are easy to find and service
- Low barrier to understanding, building and configuring
- Limitations on certain linux and hardware combinations
When we consider the configuration of a typical Desktop build, given windows as the OS, the NTFS filesystem is actually rather performant for NVME high BW SSD applications. Increased disk counts do not scale out as well in software RAID 0, which while a bummer is also expected as mentioned the limited number of desktop slots available. In a situation when a business would need a large SSD array in a windows environment, the go-to is hardware-based RAID so the NTFS filesystems performance as disks are added degrades with disk count more rapidly than you see with a BTRFS filesystem on an Ubuntu or Linux distro.
What this all means for Chia Mad Max Plotter on Desktop Machines
Good things happen when you combine Windows 10, small amounts of disks, and non-ramdisk configurations. This also happens to be the most common and lowest barrier to entry builds around. The performance with single SSD’s split into a -t and a -2 are rather good, even outstripping the performance you can get on the same machine in a Ubuntu/BTRFS setup on the exact same hardware as we can see in the graphs below.
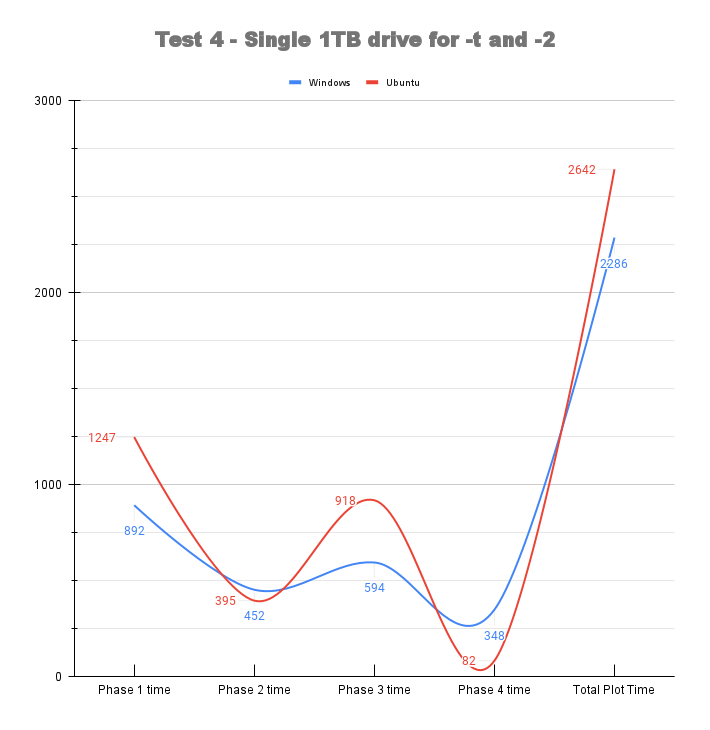
As we can see on our reference machine, which does happen to be a server with the exact same hardware run with the same plot build cmd arguments in Windows is actually faster than in Ubuntu by not an insignificant margin of 356 seconds, about 4 minutes. A quick note about BTRFS, it is not the best choice in Linux for a smaller amount of drives.
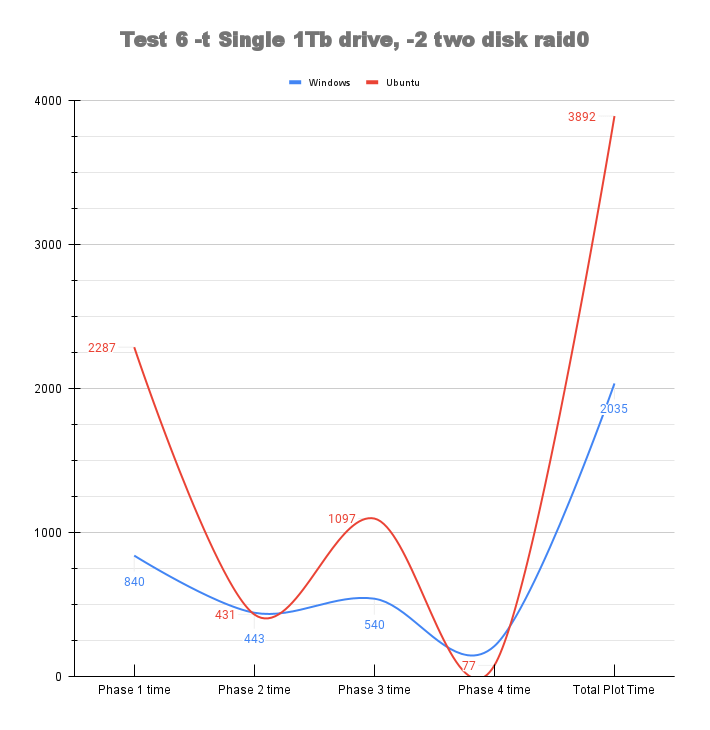
The picture gets worse as we add a second drive in software Raid0 for BTRFS and better for windows with that same second drive. Windows now gains about 250 seconds over the previous test and Ubuntu gets significantly worse. This is a common observance with 2 disk Raid0 in BTRFS but does not persist past 2 disks.
What this all means for Chia Mad Max Plotter on Servers
If you can get a full 256GB or partial 110GB ramdisk, you have a very strong reason to use Ubuntu. Additionally, if you have a large array of disks for a Raid0, above 4, you should use Ubuntu/BTRFS or F2FS which I am testing currently. One thing is certain, ramdisks and windows, given the need for third party software, is not a kernel consideration optimized solution as it is in modern linux distributions.
Addressing first the inflection point where pure disk-based performance on BTRFS Raid0 outpaces pure Raid0 performance on Windows with NTFS, we can see the gap when we run 16 SSDs in a Raid0 below head-to-head.
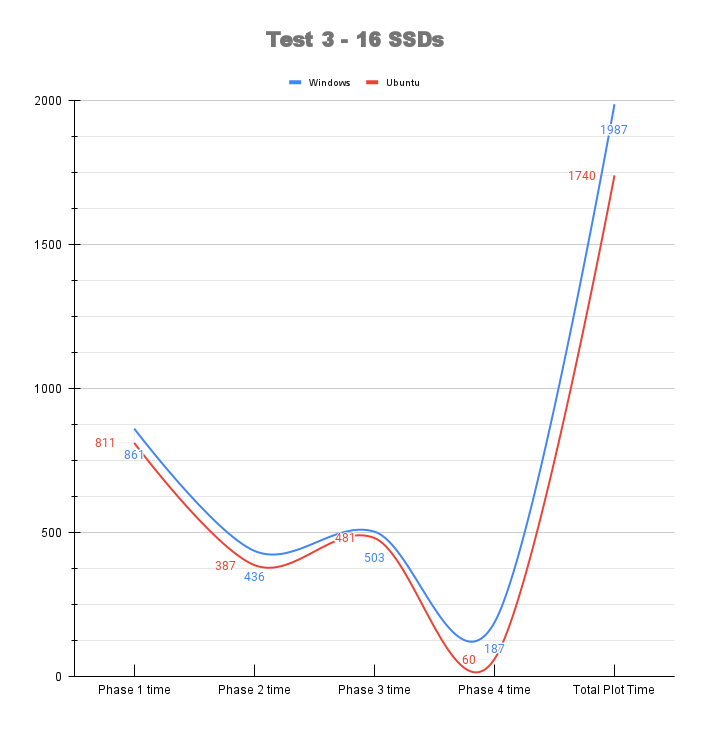
As you notice, the plot time for Windows/NTFS does gain, but not by much. Hitting 1987 secs is only a gain over a 3-disk configuration of 48 seconds. In a final add-on test that was not included in the charts as I did not test it originally in Ubuntu/BTRFS is a split 6/2 configuration test for Windows with a -t on a dual 1TB SSD and 6 1TB SSD -2. That final time was 1919 seconds, a gain of just 68 seconds but with half the SSD’s. This important result points to 2 things you have to consider if you are using NVME or SSD arrays in Windows.
- Windows NTFS fs does not scale out software Raid0 stripe performance as you add disks past 8.
- The pcie-2 bandwidth bus is a heck of a bottleneck, and oddly the same hardware in Ubuntu and Windows gets reported differently and at different link speeds. I am not an expert on LSI hardware that is the underlying silicon in my flashed H710’s, but there is something interesting happening here. In Ubuntu it reports a link speed of pcie-3, in windows pcie-2. I have someone I will be asking who knows a lot more about HBA oddities and will report back on that, but the observed differences may be actually HBA based.
RAMDISKS and Mad Max Plotter for Servers
Servers are built for a different use case than a home user typically needs and as such have significant performance in mind as part of their design. Chia is of course an excellent all-around stress tester for a computer’s components asides from the GPU (yet), so these results have implications far beyond just plotting Chia.
Commodity older server hardware has some great positives if you can find the format that works for you. A lack rack is not necessarily everyone’s cup of tea no matter how many virtualized desktops they can run on it or how fast it plots.
That is why the Dell T620 and the HP Z820 are great options for a home user looking to get into the Server space. They were designed for the small business office that often needs more local processing power and redundancy than a desktop can handle. They are also quiet, and come in tower formats, some with nice rolling casters to make carting them around self-contained and easy. I know I love my T620, and so does Mad Max.
Do you have 16 free ram slots on your motherboard? Unless you have a server, let me answer that for you. No. That means servers can use cheap 8GB sticks to get to 128GB ram. Do you have 24 free slots? A Dell T620, R720 and similar does. That allows you to get 8 x 16GB sticks plus 16 x 8GB sticks and get to 256GB ram. What does that mean for Mad Max? Numbers like these.
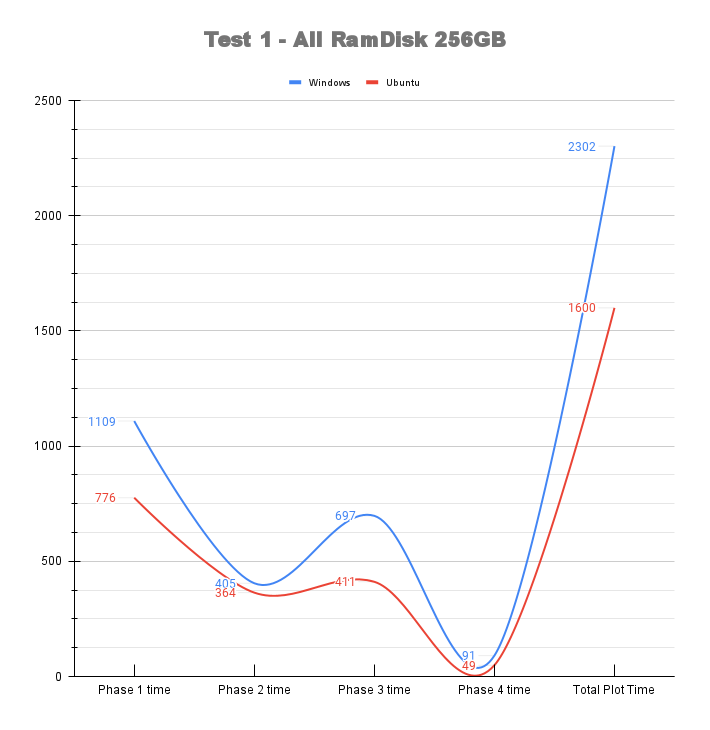
Hopefully this gets the point across as to why you do not want to use a full 256GB ramdisk in Windows Server 2022 with DDR3 given the prior numbers that beat this with various Raid configurations if you must use Windows OS. Windows has some funky NUMA issues with possibly older versions of Server.
I ran tests on Server 2016 that were outlandishly bad. NUMA. Server 2022, none of those issues presented. Windows Server 2016 is a lot like earlier releases of windows 10. Windows 2022 is pretty much a current build of Windows 10. If you are running a dual socket desktop on an older Windows 10 and have funky problems, update to the most recent.
The 1600 seconds here represents the best time of any test on dual 2667v2 system can produce with Mad Max in Linux and beats out Windows by a whopping 702 seconds. Are you not glad someone else is testing out these land mines before you step on them?
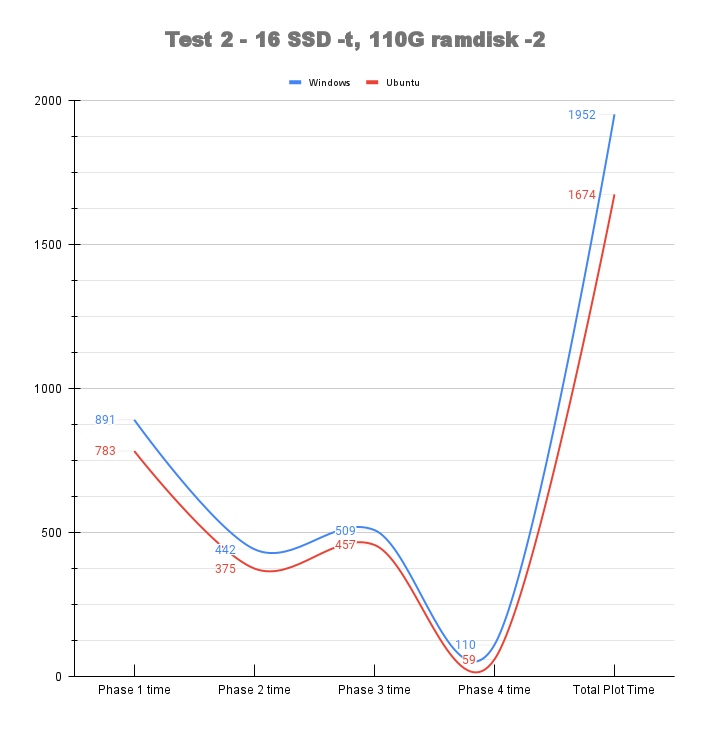
Also impressive are the results you see here with a 110GB ramdisk and 16 SSDs in a Raid0 for the -t. Again, in those very affordable 8GB sticks. Note how the windows time gets BETTER here? Ramdisks are just not a Windows recommendation in a cheap fashion and even in DDR4, well we will get to that in another article. Let’s say at the price of DDR4, I am not convinced it is a good idea vs adding a second machine.
In the final head-to-head ramdisk test we use a 110GB ramdisk and a single 1TB SSD. In Ubuntu we can see the 1903 time here slightly beats the 1919 best overall time we could get in Windows with 8 SSD drives, similar performance one would see as a Raid0 of 3-4+ NVME’s given cache limitations. This simply points to accepting a lower plot completion time as the optimum solution for Windows with a few high-grade Samsung SSDs like the 870 EVO 1TB that both have high sustained write performance.
In the same test we see Ubuntu putting up very nice numbers. This test is in the server’s section as the high amount of ram used here but if you can stomach getting 128GB in 32GB sticks for a desktop machine it is very reproduceable in those settings as well. Not at a cost savings given all the hardware configs I can find but still it is doable.
Conclusion
In a Windows environment, you are hard pressed to justify large Raid0 arrays outside a few drives. Additionally overall NVME performance and lifespan is a sore spot for many a plotter out there, and we feel ya. There is a reason we use higher end consumer SSD’s. 0 failures and 0 bad blocks so far with a total over 2PiB written on our arrays and ramdisks. We personally use 110GB ramdisks and multi disk Raid0 SSD arrays in Ubuntu to plot.
One of the largest zones of complaints in Chia is the lack of expected performance from NVME drives, which we are working on getting numbers to show exactly why that occurs, but it is a predictable phenomenon given the very large size of a plot at about ~106GB.
So, is Ubuntu Faster? Yes overall, given a ramdisk is in play. Is Windows faster? Not overall, but in a low disk count setup it can be. Therefore, in the end it comes down to “it depends on your setup” which comes down to personal preferences in OS and Computer format being a desktop or a server.


3 Responses
I don’t want invest too much than I use for plotting 5 of 2.5″ hdd 5400RPM extracted from laptops where they were replaced to SSD. All disks connected to usb throw one port and usb 3.0 hub. Using btrfs on raid0 with linux I make one plot in 11700-11900 seconds on amd ryzen 5500u. It is also my main computer where many other tasks runs. Very cheap solution compared to described here.